Event
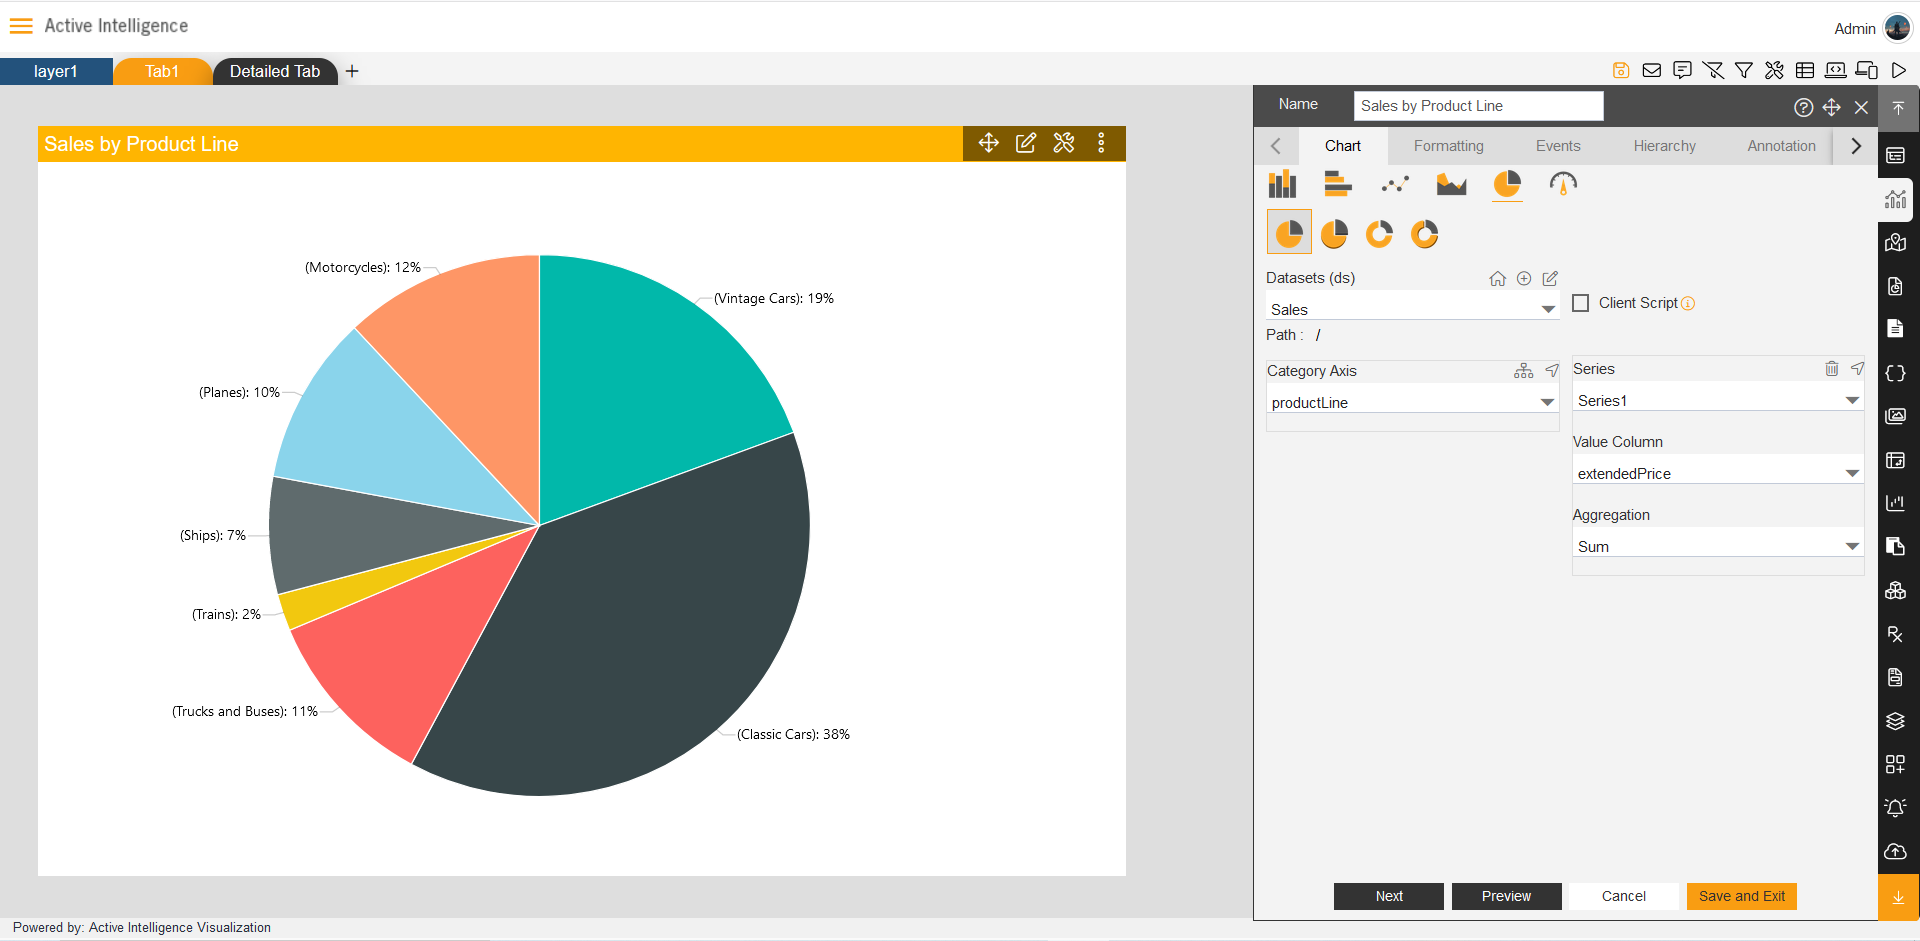
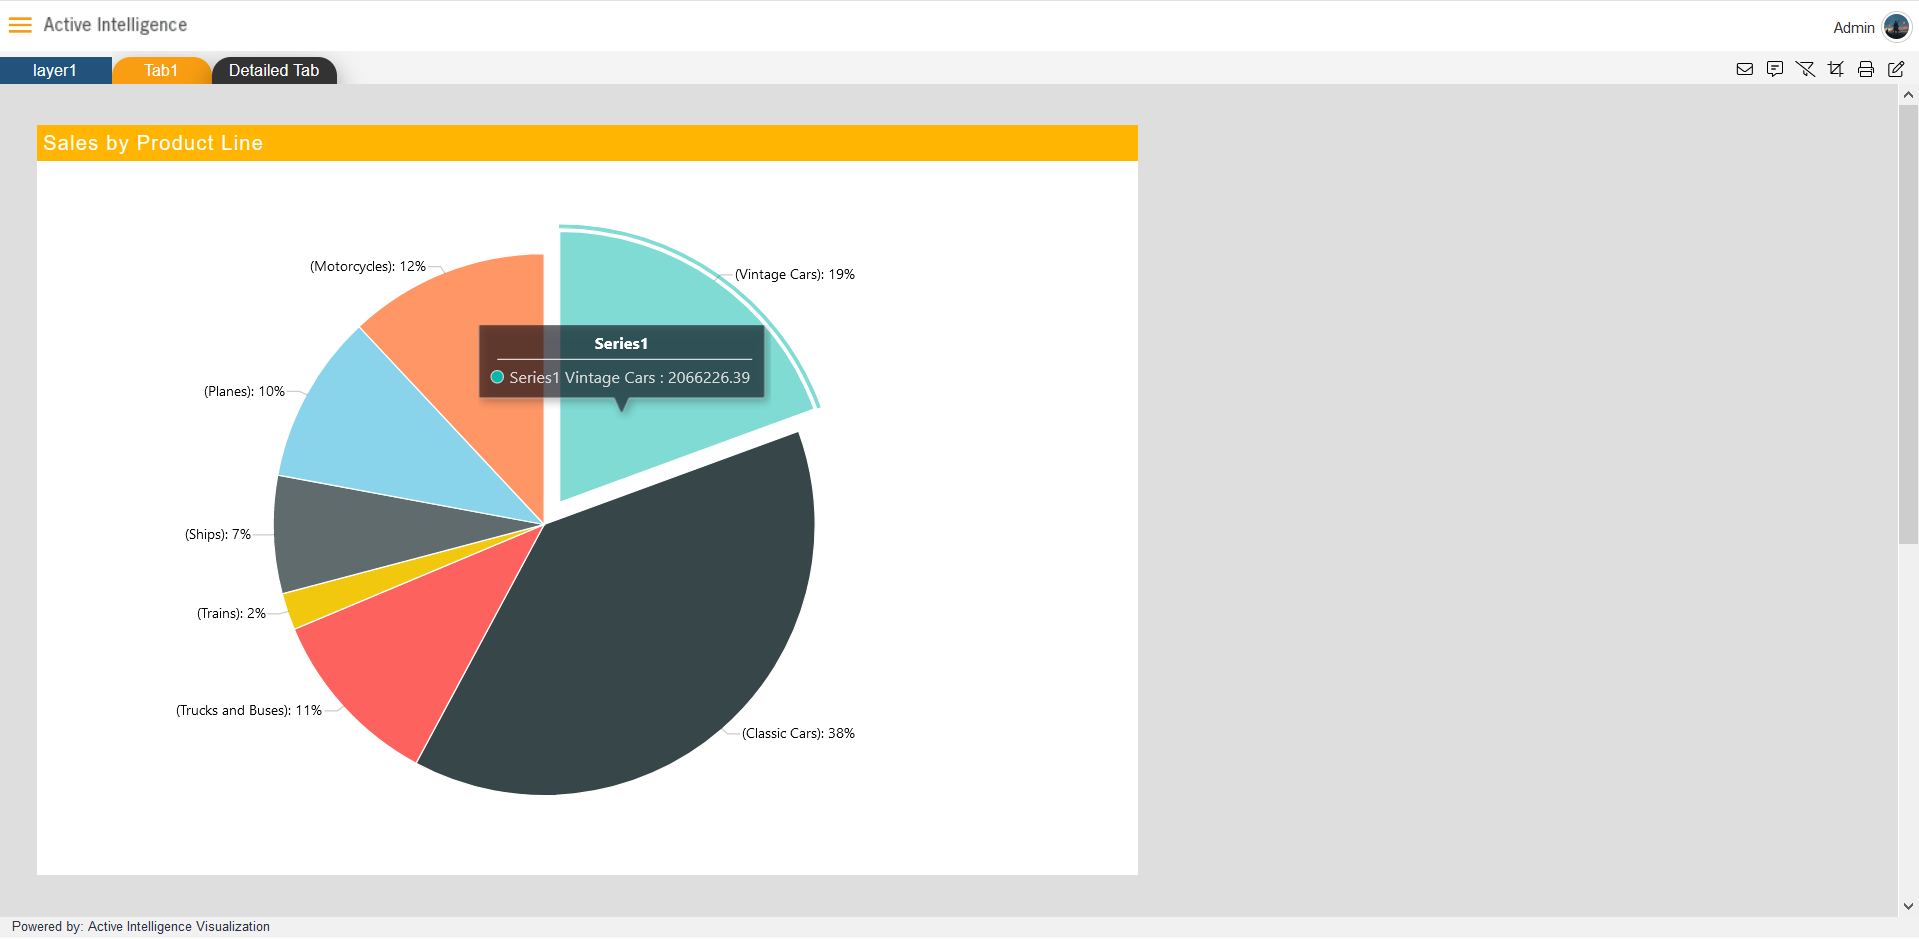
1. Create a pie chart in dashboard. Add following values in chart, As shown in figure below:

- Name: Sales by Product Line
- Datasets: Sales.ds
- Category Axis: productLine
- Value Column: extended Price
- Aggregation: Sum
2. Add second tab in Dashboard.
- Click on plus (+) icon from Tab-Layer bar, as shown in figure below:

- Add Name as Detailed tab.

- Click on Create tab to add tab in dashboard.
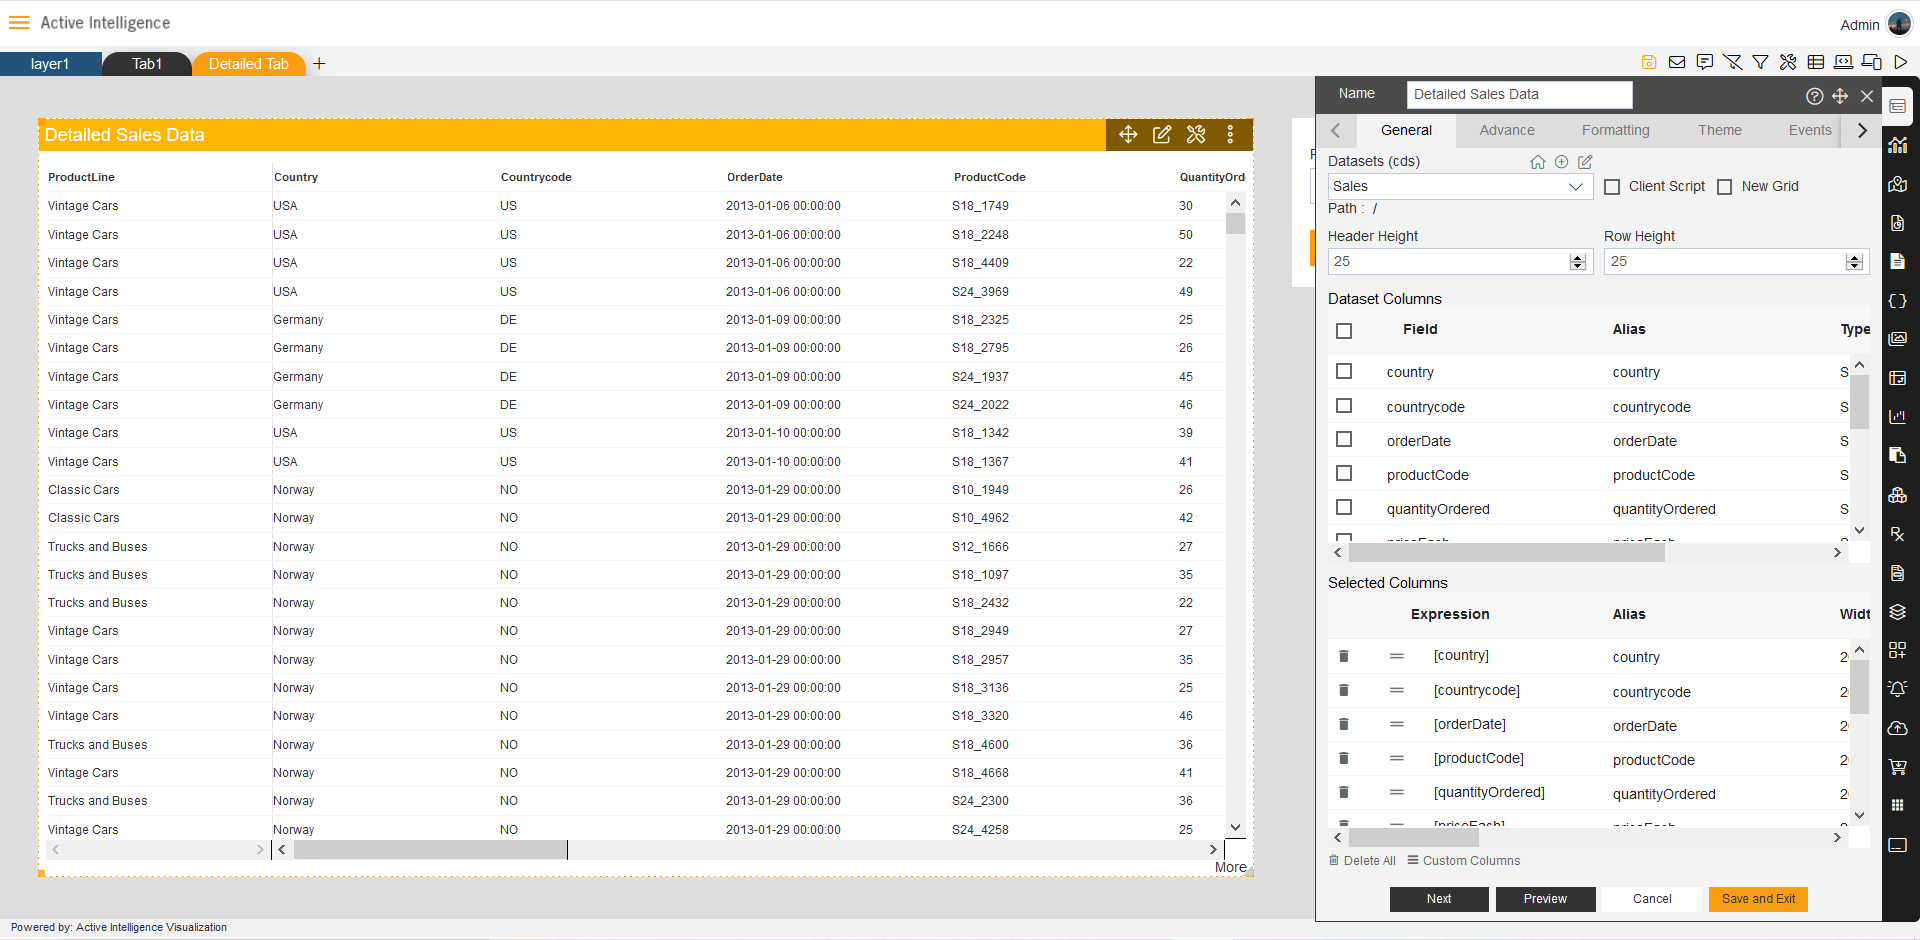
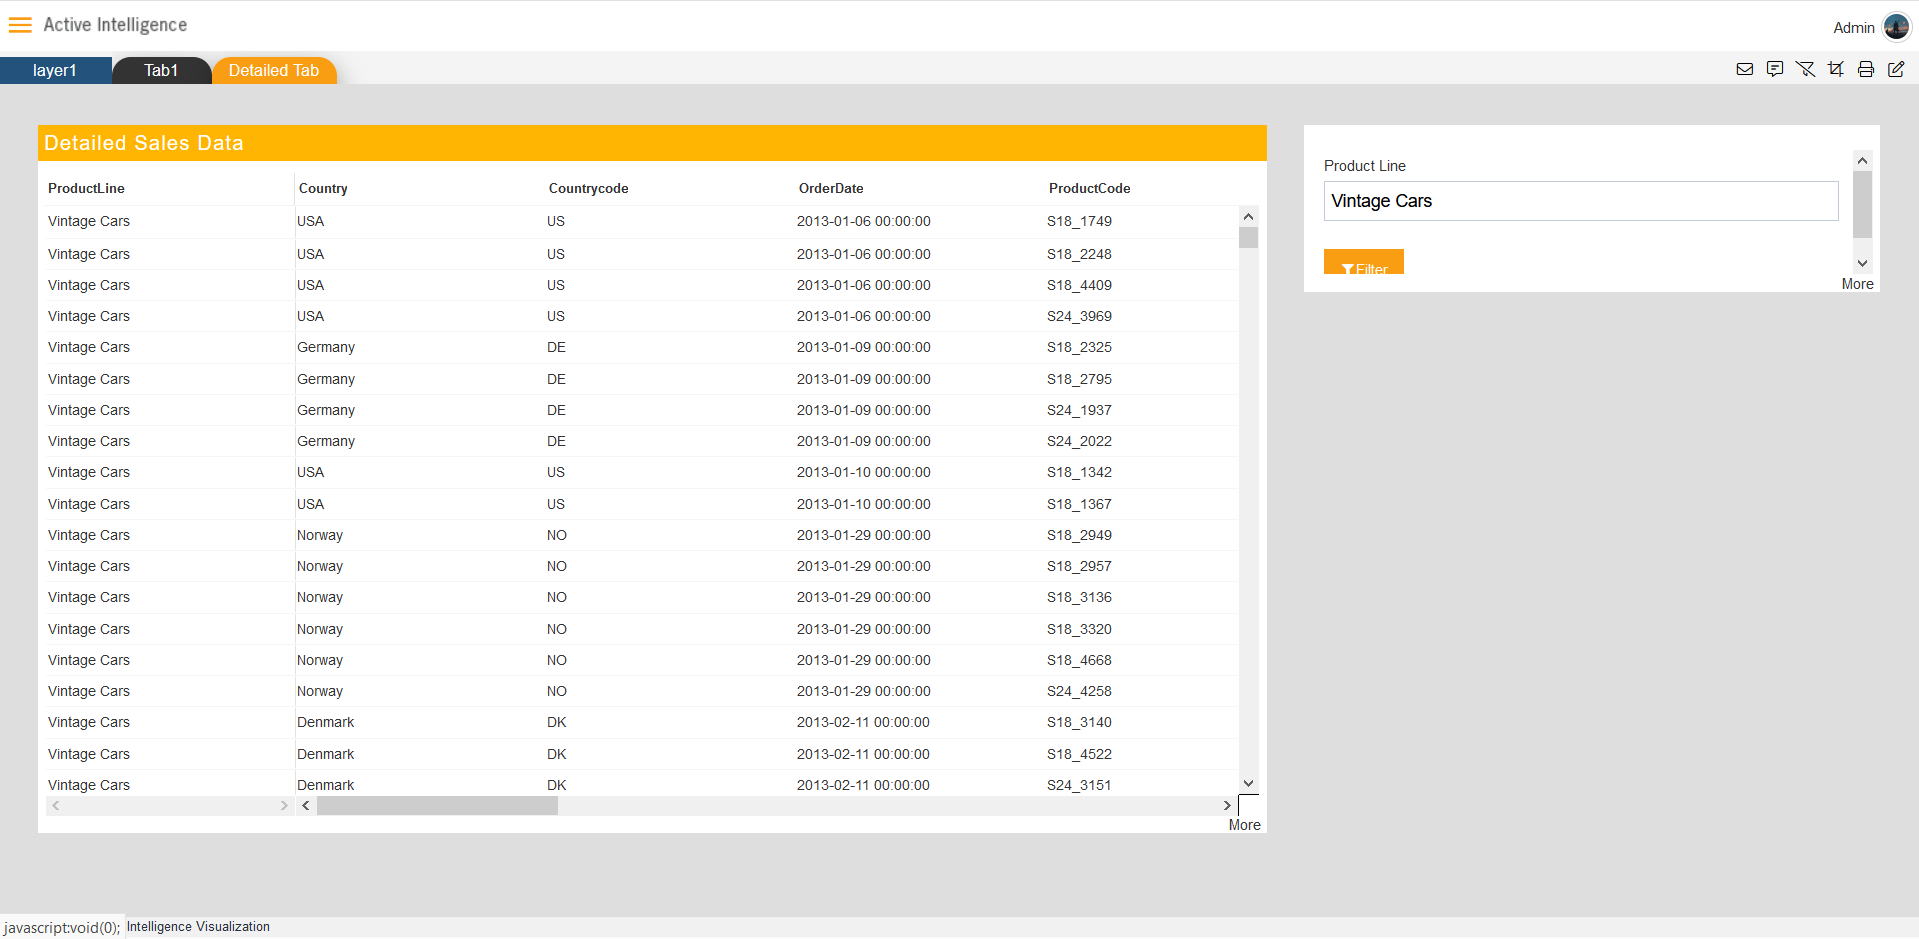
3. Add Table widget in Detail Tab.
- Click on Table Widget icon from vertical menu bar in Dashboard.
- Add Following data in Table Widget:
Name: Detailed Table Data. Dataset: Sales.ds (Select all columns from Dataset Columns)
4. Create dashboard filter and link table widget with a filter.
- Click on Filter icon to open Filter’s dialog-box in dashboard.
- Click on Add filter button from filters dialog box, as shown in figure below:
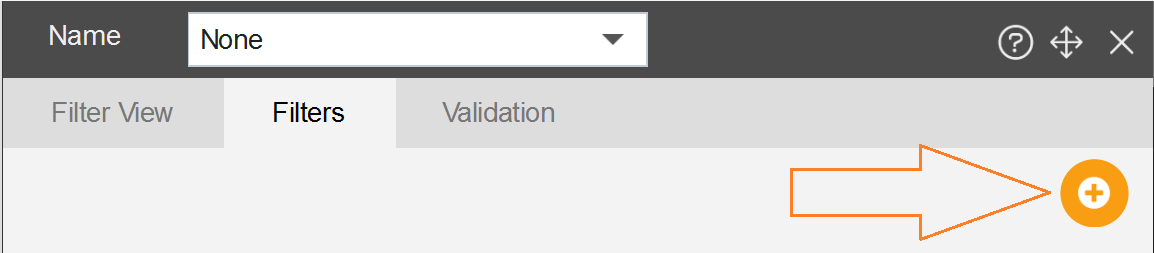
- As you click on the add icon the name dialog will get opened, as shown in figure below:

- Add Name of filer and click on Right icon. as shown in figure:

- After clicking on right icon, the filter gets created.
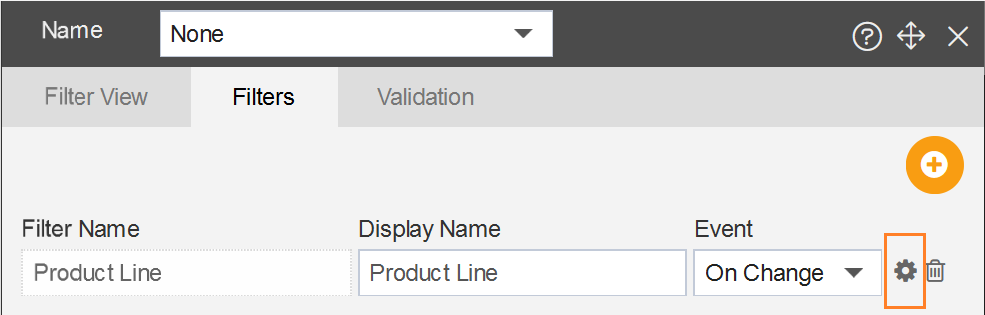
- It will lead to the Filter widget tab in Filter settings, as shown in figure below:
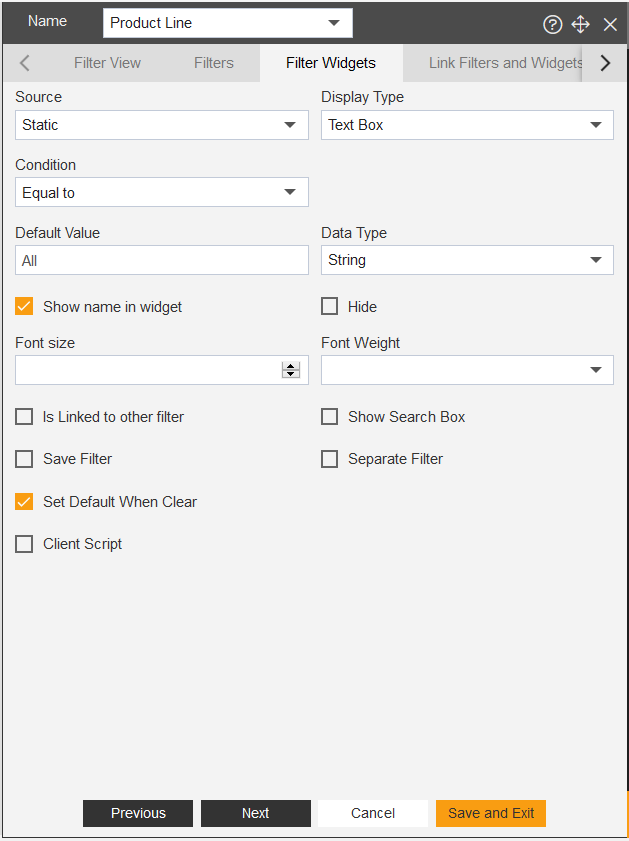
- Keep the filter widget settings default, then click on Link Filter and Widget.
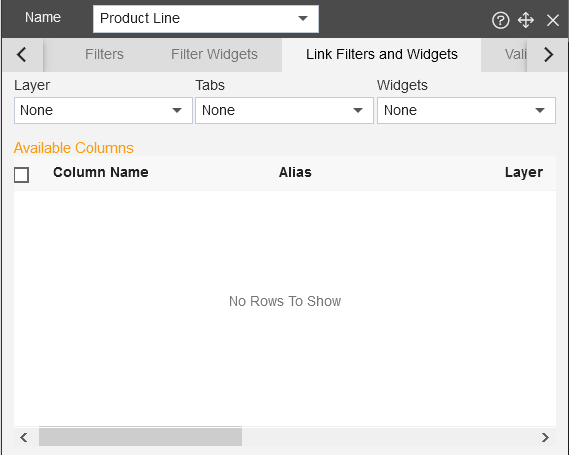
- Now select widget from Layer, Tab, and Widget to link with filter as shown in figure below:

- After selecting widget, choose the table field to add in filter, as shown in figure below:
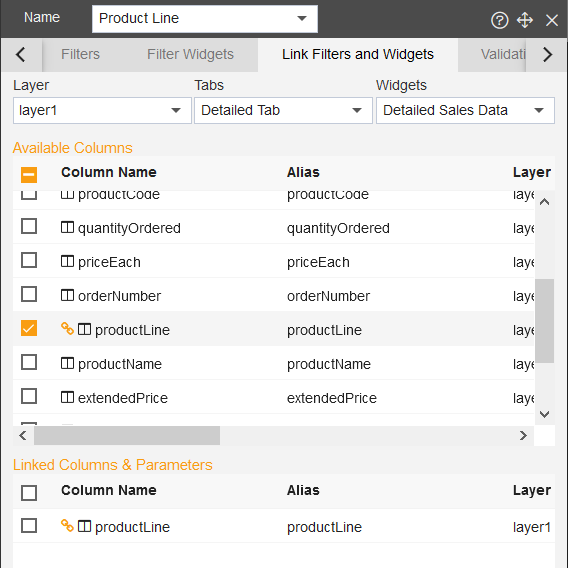
- As user select field from Available column, the column gets added into the Linked Column & Parameters.
- Then click on previous tab and go to filter view, as shown in figure below:

- Click on Plus (+) icon to add the Product Line filter on Dashboard.
- Now you have two tabs with two widgets are ready, lets move on next step.
5. Create an event which can change tab on value selection.
- To add event into the widget, go to Tab1 and edit the Sales by Product Line chart.
- open the Event tab in Edit box. as shown in figure below:
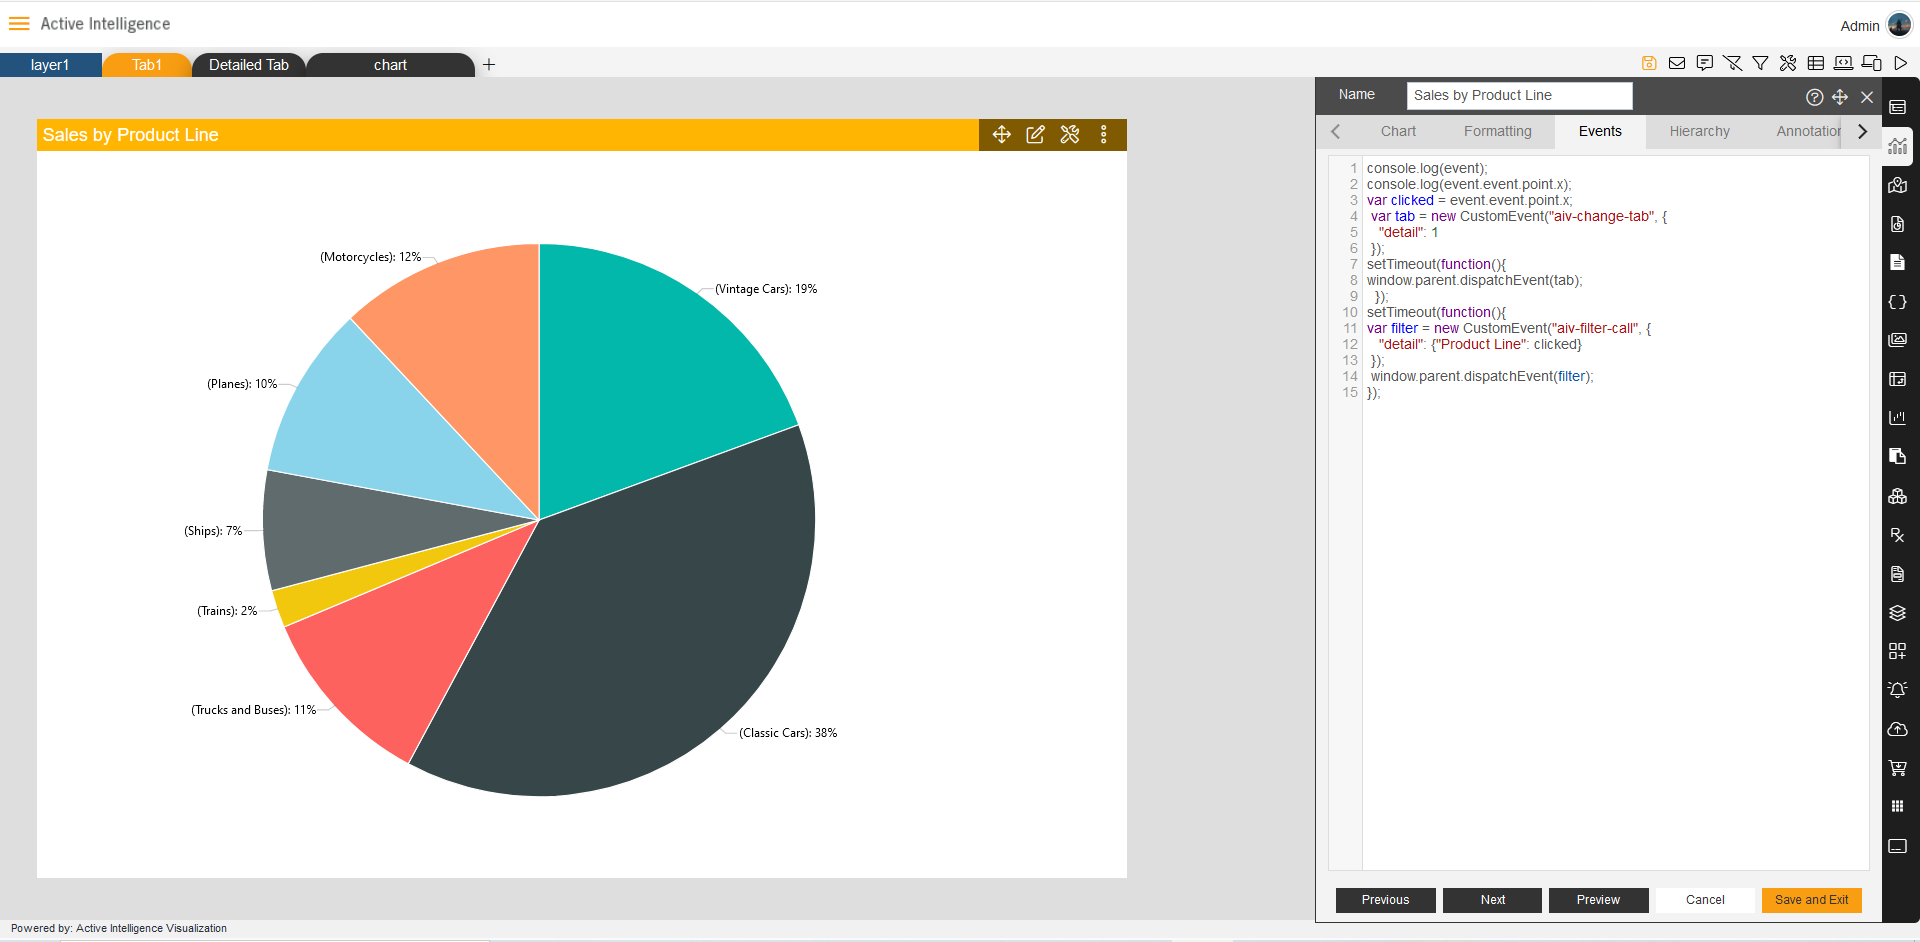
- Add Code to create event, the first event changes the tab and second event used to filter the value in Detail Table.
- Sample code (You can copy from here):
console.log(event); console.log(event.event.point.x); var clicked = event.event.point.x; var tab = new CustomEvent("aiv-change-tab", { "detail": 1 }); setTimeout(function(){ window.parent.dispatchEvent(tab); }); setTimeout(function(){ var filter = new CustomEvent("aiv-filter-call", { "detail": {"Product Line": clicked} }); window.parent.dispatchEvent(filter); });
- Now click on save and exit to save the event and close the widget.
6. Now click on Sales by Product Line and then it will move you to the Detail Tab, which filters in Detailed Sales Data, the data you selected in Sales by Product Line.
 >
>
✒️ In order to understand in detail about other features, click on the following links:-